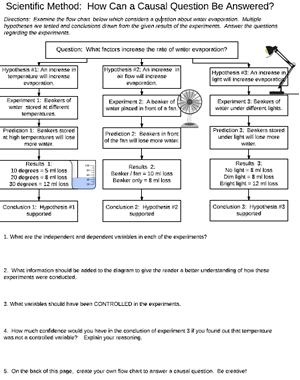
Students examine a flow chart which considers a question about water evaporation. Multiple hypotheses are proposed to test the effects of air flow, light, and temperature on the rate of water evaporation. Results and conclusions are then given for the experiment.
Analysis questions ask students to identify the dependent and independent variables, and suggest variables that would have needed to be controlled in the experiment. Finally, students create their own experimental question and flow chart.

Grade Level: 9-12 | Time Required: 30 min
CCSS.ELA-LITERACY.RST.9-10.7 Translate quantitative or technical information expressed in words in a text into visual form (e.g., a table or chart) and translate information expressed visually or mathematically (e.g., in an equation) into words.
CCSS.ELA-LITERACY.RST.9-10.8 Assess the extent to which the reasoning and evidence in a text support the author’s claim or a recommendation for solving a scientific or technical problem.

