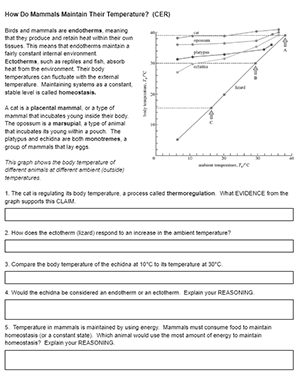
Students examine several graphs that explore endothermy in animals. In the first graph, the body temperatures of several animals is displayed as a function of the ambient temperature. Students should notice that the lizard’s body temperature changes with temperature, but the mammals maintain a constant internal temperature. The graph also includes monotremes and marsupials, which are endotherms. Their body temperatures are slightly influenced by the ambient temperature.
The next set of graphs focuses on adaptations of mammals. The first shows the metabolic rate (oxygen consumption) of a mouse and lizard as the external temperature changes.
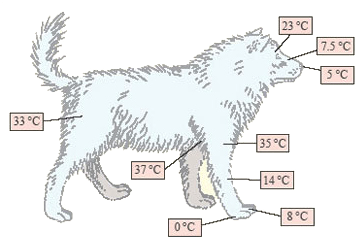
The second graph of this page shows how insulation and layers of skin warm air before it gets to body tissues. The third images shows a dog with body temperatures displayed for different parts of the body. The nose and paws tend to be colder than other parts of the body.
Finally, students synthesize the concepts to complete a CER (claim, evidence, reasoning) chart. They compile the evidence from the graphs to support the claim that mammals use a variety of strategies to maintain homeostasis.
Animal Physiology
Most of the graphs and images come from OpenLearn, which is a great free resource for students. The course on mammals focuses on reproduction strategies among mammal groups. It also includes a section on thermoregulation and metabolism.
I use this activity as a part of a larger unit on animal physiology where students compare body systems. For example the digestive system of a herbivore compared to a carnivore. This unit also includes a dissection of a frog and fetal pig. You can also download my slide representation from Google docs for additional content on mammals.


