
Reading diagrams and data is important for several reasons. Understanding complex information like charts and graphs help us understand complex information quickly and easily. Science diagrams often provide summaries or illustrate a complex process.
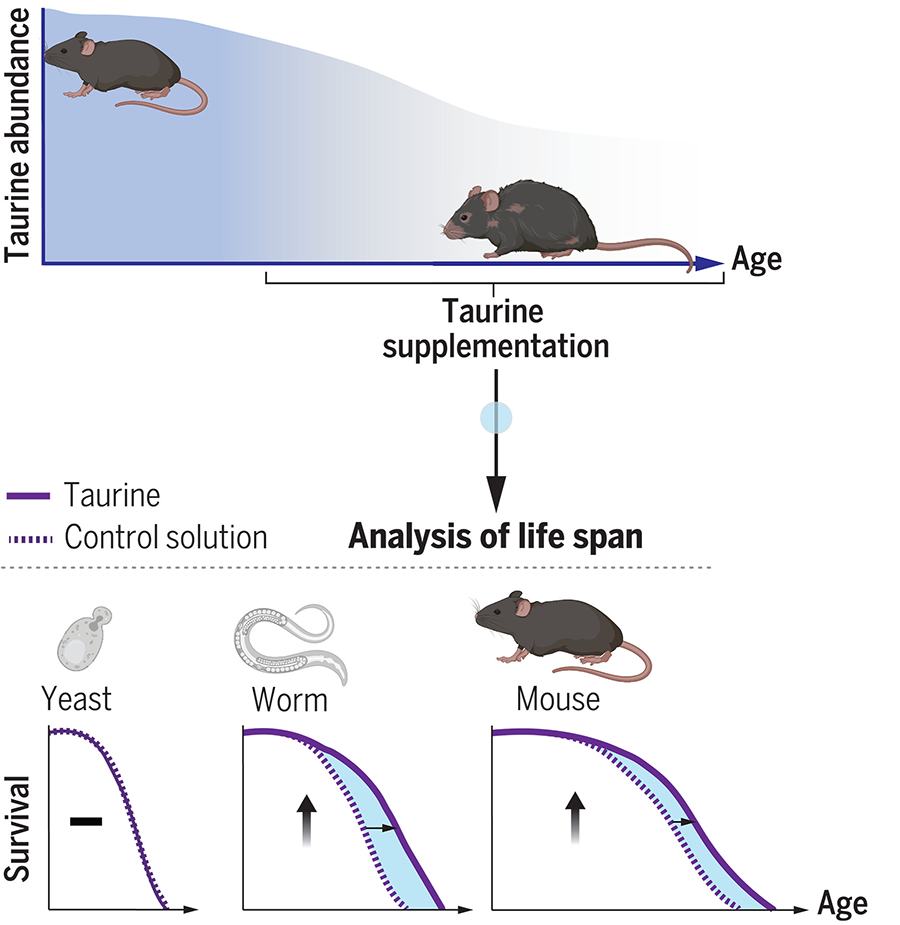
Consider this information from a PRIMARY SOURCE titled “Taurine deficiency as a driver of aging.” Researches examined the effects of taurine on the health of animals (and yeast). Taurine levels decline as we age. Could adding taurine to your diet improve your health?
Students analyze the graph (with some background information). They identify the controls and variables. They identify the claim, summarize the evidence, and write a reasoning statement. (CER)
I use graphs like these in my biology classes for students to practice data analysis. In most cases, they align with the current topic. This graph on taurine deficiency fits with the biochemistry unit.
You can also use visual aids, taurine is a supplement that you can purchase. Or you can bring a can of Red Bull! If you really want to spice up the activity, a case of the energy drink and share with the class!