Students apply the scientific method to determine what is causing algae growth in a pond. This activity works with introductory lessons on the nature of science and how to conduct experiments.
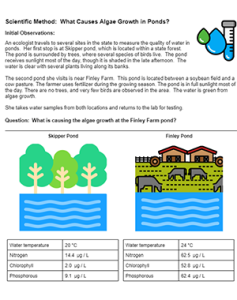
In this activity, students examine data from two ponds. One pond is near a farm and the other is in a forest area. Data includes temperature and levels of phosphorous, nitrogen, and chlorophyll. Phosphorous and nitrogen are commonly found in fertilizers. The farm pond has much higher levels of these compounds than the forest pond.
The level of chlorophyll is an indicator for algae growth. The pond near the farm has much higher levels of chlorophyll. Note, the data shows units as µg / L, so you may want to explain what those units mean (micrograms per liter). Data also shows water temperature, but it has little effect on algae growth, though students may note that the forest pond is cooler than the farm pond.
Laboratory Data on Algae Growth
On the next page, students write a hypothesis that explains the algae growth. A set of images illustrates an experiment that tests this hypothesis. Images show two aquariums with fish and plants. Phosphorous and nitrogen are added to the experimental tank. The control tank does not have those compounds.
After thirty days, the experimental tank appears green due to algae growth and the control tank is still blue. The images are in color, so this activity may work best if assigned on Google classroom. The print version will show the green tank as a darker color. Both have quantitative data on chlorophyll levels for each tank.
Students then answer questions about the independent and dependent variables. They describe the differences between the control and experimental tank. Finally, they write a conclusion about what is causing the algae growth in the ponds. For example, fertilizer from the farm is flowing into the pond and causing algae growth.
Extension
When we get to the chapter on climate, my students also examine data on harmful algae blooms: Investigating Algae Blooms and Dinoflagellates. This study examines real data from water sources across states to determine where algae blooms are concentrated.
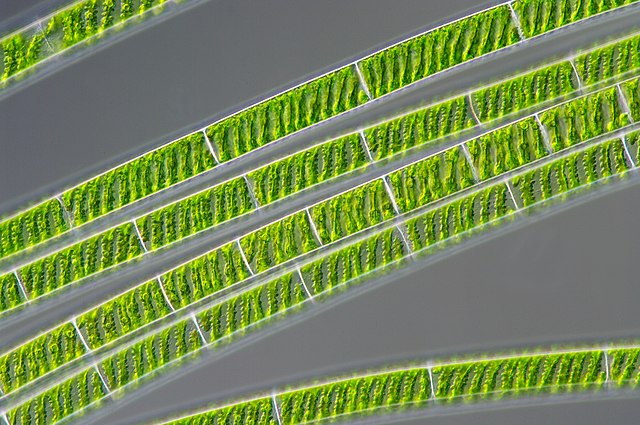
I also have a collection of algae slides that students can examine once they learn how to use microscopes in the next unit. My favorite algae slides are euglena, spirogyra, and volvox. Students also examine live aquarium plants with a microscope.


