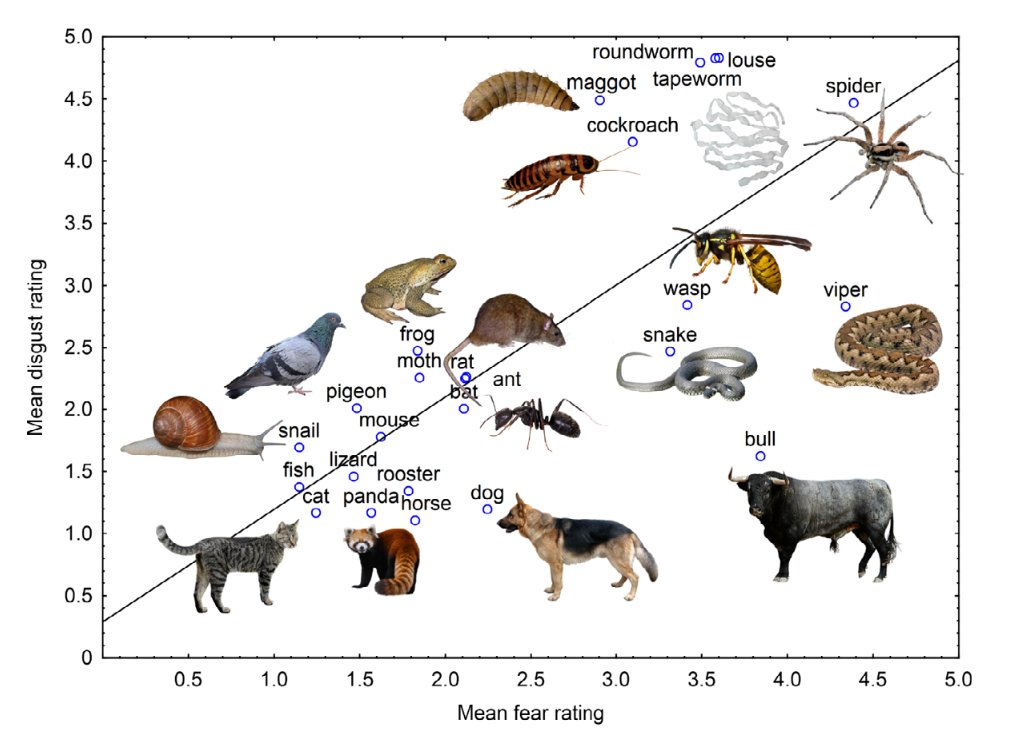
Disgust and fear are two emotions associated with phobias. In one study, subjects rated 25 images of animals and rated them based on how scary or disgusting the animals were. Participants answered questions about their discomfort or anxiety for a set of stimuli. (Fear Survey Schedule). A separate survey analyzed their feelings of disgust for certain animals.
I made this data analysis activity for a rainy day in October. Students model the study by ranking the animals individually and comparing the results as a class. First, you show images of things that people usually find scary or disgusting. The slides display snakes, frogs, cats, worms, and other animals that the study participants ranked.
Certain trends will be clear: snakes and spiders are usually found to be disgusting. Birds and cats usually rank low for both fear and disgust. This is also an opportunity to discuss how surveys are used in research, particularly psychology research. Do people always report accurately on these surveys?
Certain trends will be clear: snakes and spiders are usually found to be disgusting. Birds and cats usually rank low for both fear and disgust.
Students then examine the graph from the study and answer questions about what the data shows. Which animals are the most disgusting? Which are the scariest? Is there a correlation between disgust and fear?
Finally, students explore possible evolutionary reasons why some animals might cause fear. For example, avoiding snakes that could be deadly might have been an advantageous trait. Fear of snakes and other dangerous animals may have evolved as a behavioral trait.
Alternatively, you can take a few minutes to explore the data and discuss evolutionary reasons for human fears. Some days, I’ll put a graph on the board when students enter. They use the I2 strategy: what the data shows, followed by what it means. These quick (bellringer) activities can give you time to prepare for class or complete tasks, like taking attendance.

Other Data Analysis Activities
- Analyzing Data – explore different types of graphs and data
- Scientific Method: Graphing and Growing Animals – explore how the size of a sponge animal changes over time
- Relationship Between Migratory Birds and Abiotic Factors

