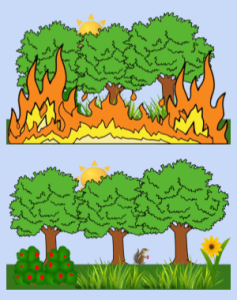
Ecological succession is a key idea in ecology that describes how ecosystems change and develop over time. It is the natural process where an ecosystem’s structure and species composition gradually shift, leading to the formation of a stable, mature community. This process involves a series of stages, each characterized by different types of species and environmental conditions.
There are two main types of ecological succession: primary and secondary. In this card sort activity, students will focus on secondary succession.
Secondary succession occurs in areas where an existing ecosystem has been disturbed or destroyed by events such as fires, floods, or human activities. In these areas, the soil remains intact, which allows for a faster recovery process. After a disturbance event clears the existing vegetation, pioneer species, often fast-growing plants like grasses and weeds, quickly colonize the area. As shrubs and small trees start to grow, they replace the pioneer species. Eventually, the ecosystem matures into a stable community similar to the climax community seen in primary succession.
I created the cards using Google slides and creative use of clipart. There are eight cards showing different scenes of a forest, a fire, and regrowth after the fire. If you open the Google slides version, and make a copy, you can edit the cards. You can also download the pdf version, which has two cards per page.
Ecological Succession Cards 
I loosely use the 3E framework for lessons: Engage, Explore, Explain. Engage students with a question about what happens after a forest fire. You can even show photos or videos of some of large forest fires and efforts to contain fires. Next, give students the 8 cards and ask them to arrange the cards in order of what happens over time (explore).
Finally, after a discussion or the arrangement and a consensus of the order, give students the caption cards. Then, they match the caption to the photos to develop an overall explanation of the event.
Note: I based the cards on this Wikipedia page and graphic. I do not have an answer key, mainly because it’s pretty obvious. The only think that might be tricky is the 1st and 8th slides which could be interchangeable. There’s a squirrel in the final image just to make it stand out a little more as the last step.
Related Resources
Examining the Stages of Succession in a Pond – view a graphic showing how two ponds change over time
Investigating Algae Blooms – analyze and color a map showing regions of algae blooms, determine causes
Exploring Range of Tolerance in Steelhead Trout – analyze a graph showing temperature and number of trout
Ecology Project – create a presentation about an environmental issue

