High school teachers often assume that their students know how to use basic word processing programs, internet browsers, and spreadsheets. My students come to me with very little knowledge in how to do advanced tasks in those platforms, like inserting a graph or image.
I created this assignment to give students an introduction into how data can be manipulated in a spreadsheet, specifically using Google Sheets.
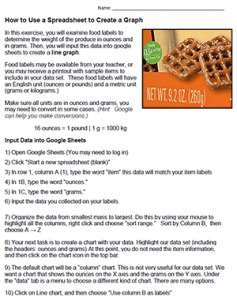
Students collect labels (or can be given labels by the instructor, pdf file also contain pages that can be printed) which include information about mass in both grams and ounces.
Step by step instructions are included to show how the information on the label is placed into the cells of the spreadsheet, then rearranged and used to create a line graph with labels on the x and y axis.
The number of labels used can vary, though the printable include 12 labels, you could alternatively collect them over the years and put a handful in ziploc bags for students to use.
The graph can also be used as an introduction into the metric system. Once the graph is made, students can use it to predict values for weights not included in the original data set.
Time Required: 20-30 minutes
Grade Level: 7-12

