Students in biology and other science classes will do many experiments and investigations over the course of the year. Some of these experiments will have handouts for students to answer questions as they complete tasks.
Other investigations may be more open-ended, where students must design an experiment, gather data, and create a document to report their results. In other words, students will be required to write the “dreaded” lab report.
A typical lab report usually contains several key sections:
- Title: This includes the title of the lab experiment, the names of the students, and the date the experiment was performed.
- Introduction: This section provides background information on the topic of the experiment and explains the purpose or objective of the experiment. It may also include a brief overview of the topic.
- Materials and Methods: Here, the experimental procedures and materials used are described in detail. This section should be written in a way that allows another researcher to conduct the experiment based on the information provided.
- Results: The results section presents the data collected during the experiment. This may include tables, graphs, or figures to visually represent the data.
- Conclusion and Discussion: A brief summary of the main findings of the experiment and their implications. The conclusion typically restates the purpose of the experiment and summarizes the key results and their significance.
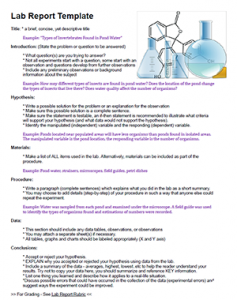
Lab Report Guidelines – A Handout for Students
This handout can help students organize a lab report for any experiment. It includes the basic layout of a report: title, introduction, hypothesis, materials and methods, data, and conclusions.
As students become more experienced with writing lab reports, they can make adjustments and combine sections. I also have students read a scientific journal from PLOS biology to show them an example of a peer reviewed scientific text and to introduce the idea of “abstracts.”
Alternatively, students can get creative with lab reports by creating infographics to display methods, data, charts and graphs.

