Chapter 5 - Populations 
5.1 How Populations Grow
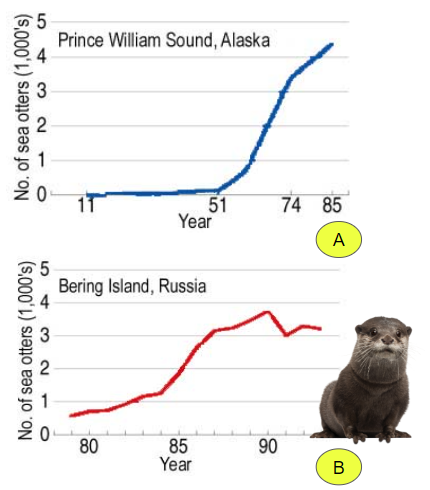
Case Study - Sea Otter Fur Trade
Geographic Range - the area where a poulation lives
Growth rate - how the population size changes
- Positive = increasing
- Negative = decreasing
- Zero = staying the same
Density - number of individuals in an area
Distribution- how they are spaced (clumped, random, uniform)
Age Structure Diagrams - compare population at each age group (rapid, slow, stable)
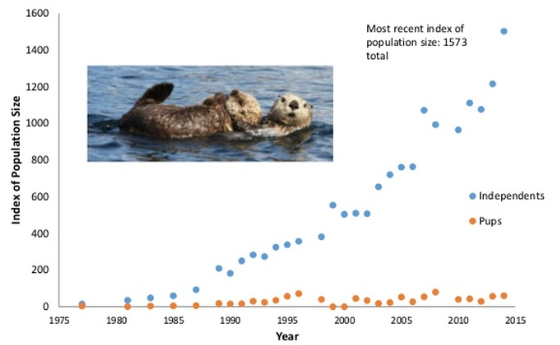
Data Analysis - population of sea otters in British Columbia (graph analysis)
Population Growth = Birth rate minus Death Rate and Immigration minus emigration
Emigration - movement out of a population | Immigration - movement into the population
Exponential growth
- occurs under ideal condtions
- J-shaped curve
- population increases quickly
Logistic growth
- growth slows or stops
- S-shaped curvie
- population at carrying capacity
5.2 Limits to Growth
Density-dependent factors (competition, disease, overcrowding, food availability)
Density-independent factors (random events, natural disasters)
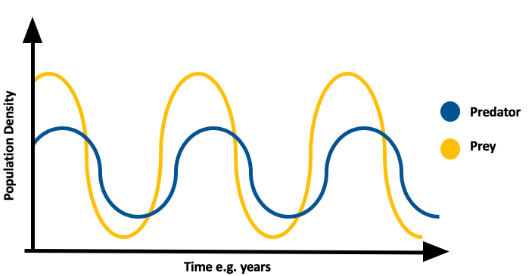
Predator Prey Relationships
- populations fluctuate (go up and down)
- wolf and moose
5.3 Human Population Growth
Populations tend to increase (rate of increase changes over time)
Population distribution - where human populations are concentrated (major cities, states)
Demography - study of populations
Demographic transition - dramatic change in population caused by lower birth rates
Age Structure Diagrams - show the size of different age groups
Measuring Population Size
- Mark and Recapture
- Random Sampling
Classroom Activities and Resources
Limiting Factors and Carrying Capacity (Key, TpT)
Estimating Population Size with Random Sampling (Key, TpT)
Lesson of the Kaibab - graph analysis
Whooping Crane Popoulation - graph and data analysis
Reinforcement: Populations - vocabulary practice