Category: Worksheets
-
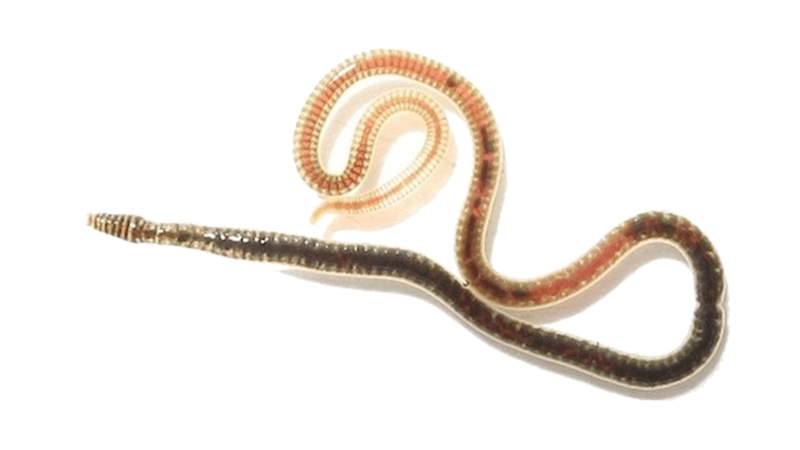
Investigation: How Chemicals Affect Pulse Rates
Students investigate the affect of chemicals, like caffeine on the circulatory system using a blackworm specimen.
-
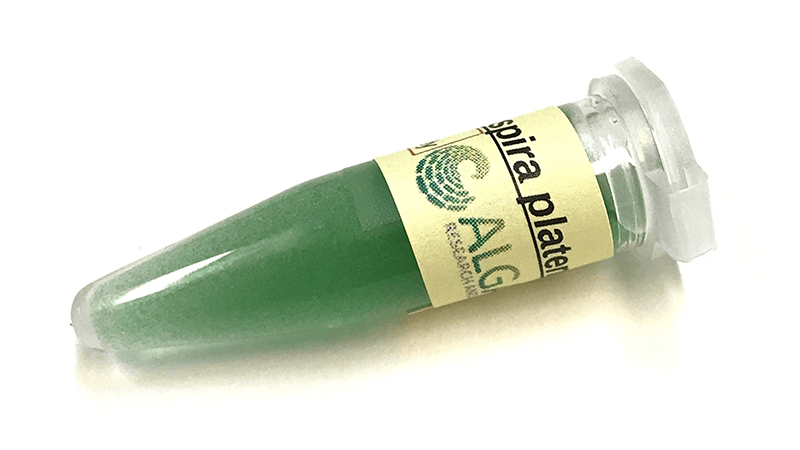
Investigation: Algae Beads and Photosynthesis
Students use algae beads to observe photosynthesis and respiration. Algae beads are placed in an indicator solutions to measure CO2.
-
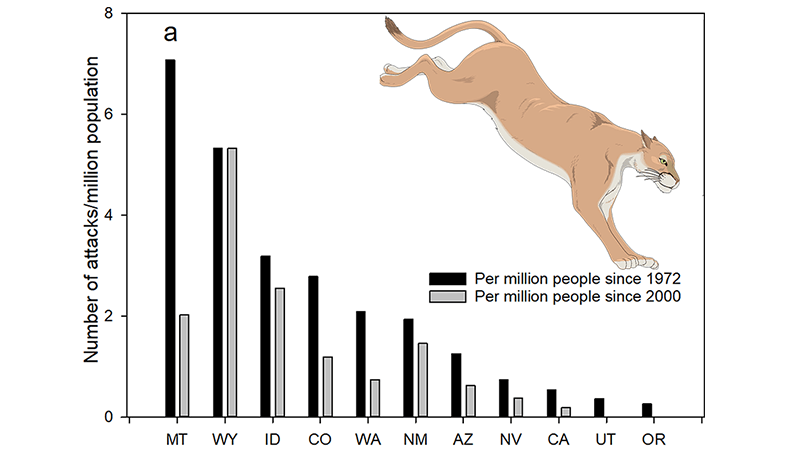
Can Sport Hunting Control Predator Populations?
Examine data that compares states that allow trophy hunting of pumas to California which does not allow hunting.
-
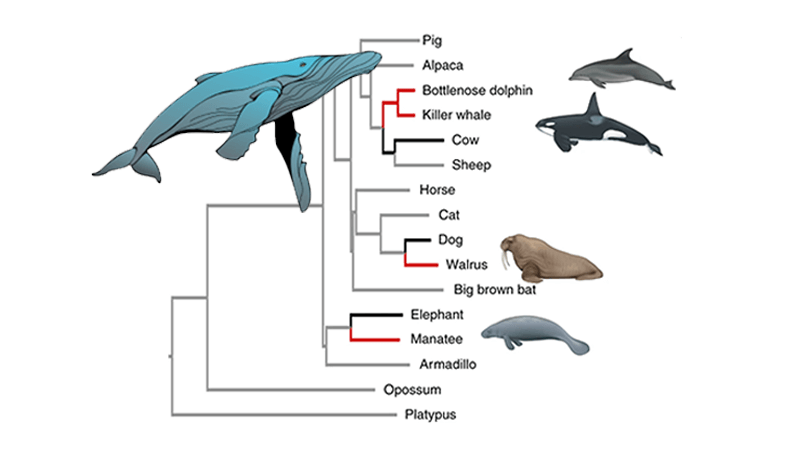
Mutations and Evolution in Aquatic Mammals
Students examine a phylogenetic tree that reveals mutations found in aquatic mammals as evidence of convergent evolution.
-
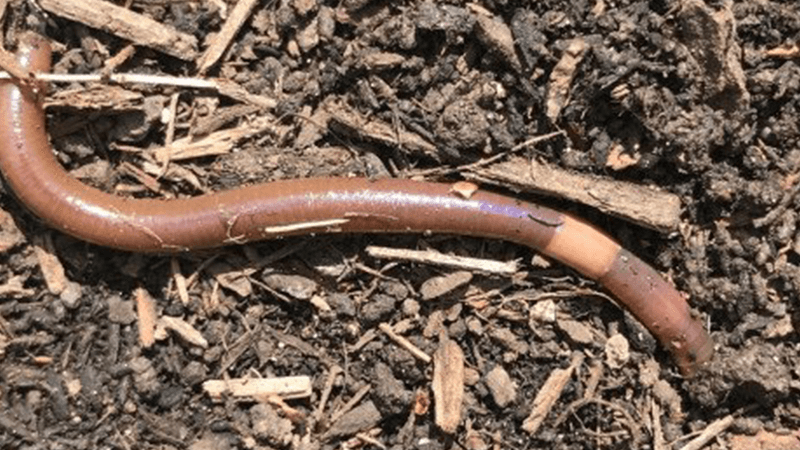
Data Analysis – Invasion of the Jumping Worms
Lesson plan uses the 5E model to explore the invasive Asian Jumping Worm and its impact on soil and forests; includes data analysis.
-
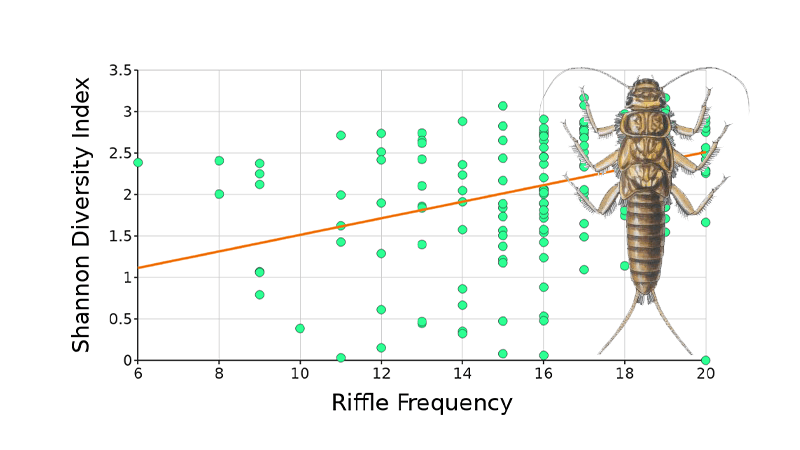
Measuring Water Quality with Biodiversity
Students manipulate data to show how water quality and stream diversity are connected. Dataclassroom is used to analyze data sets and complete a CER.
-
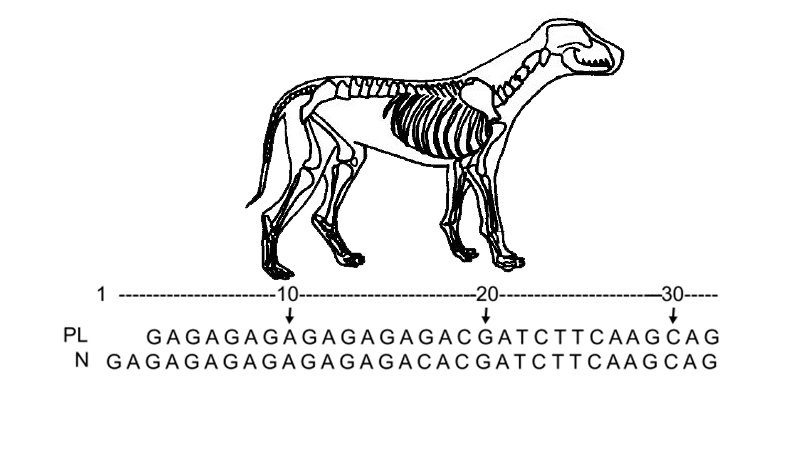
Case Study: Dogs, SNPs, and Patellar Luxation
Students learn how a genetic polymorphism (SNP) is associated with a common problem in chihuahua dogs where their patella slips out of position.
-
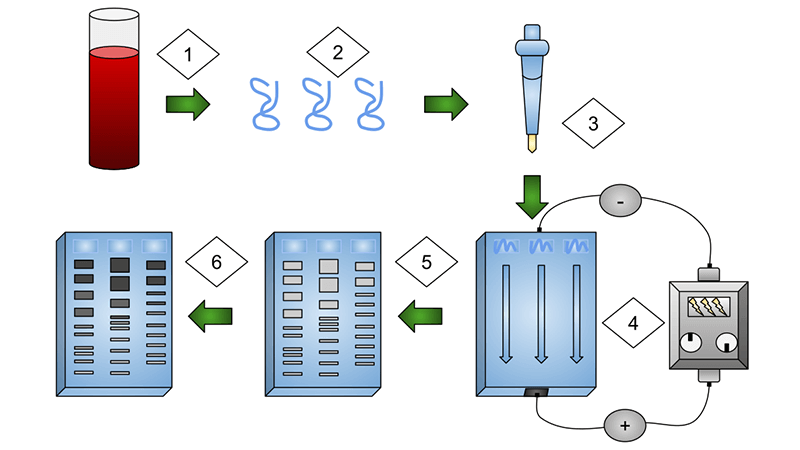
How DNA Fingerprints Are Used to Solve Crimes
Students learn how DNA fingerprints are made using gel electrophoresis. They identify which suspects match the DNA evidence.
-
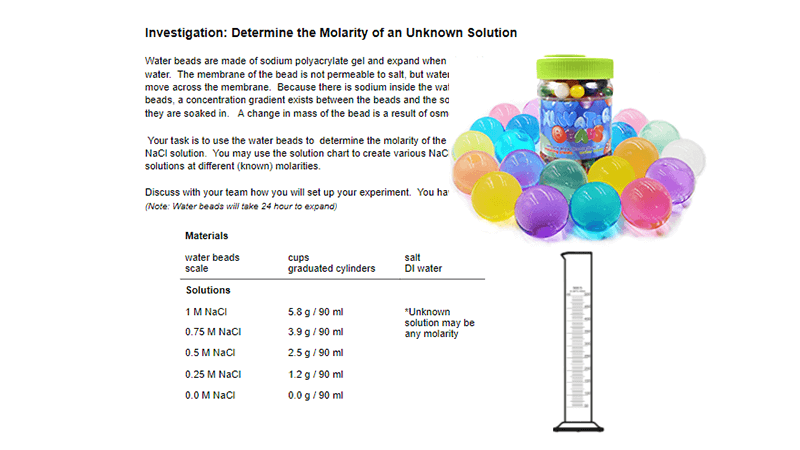
Investigation: Determine Molarity of Unknown Solution
Students determine the mass of water beads after soaking them in solutions. They use the change in mass to determine the molarity.
-

CER – How Effective Are Masks at Preventing Disease
Students examine data that show the effectiveness of mask wearing and the prevention of disease. The activity is a CER format (claim, evidence, reasoning.)
-
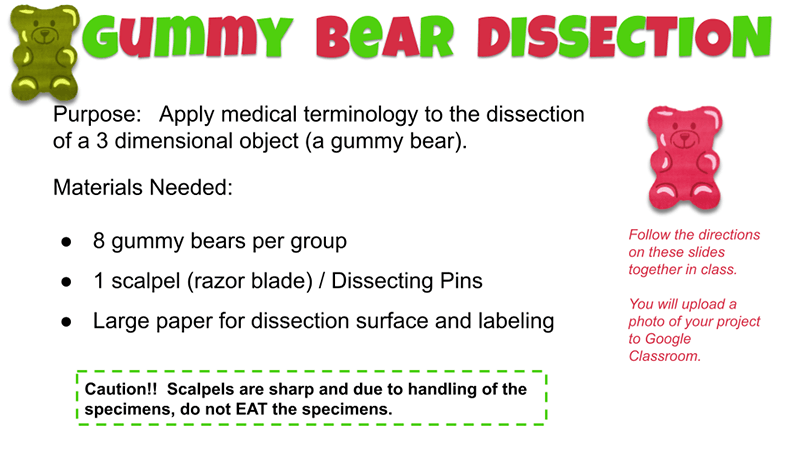
Dissect a Gummy Bear to Learn Anatomy Terms
Students use a gummy bear and scalpels to demonstrate their knowledge of anatomical terminology.
-
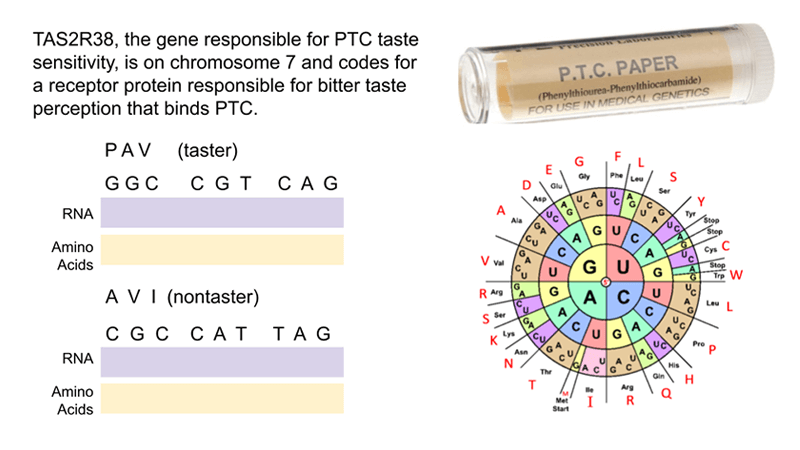
DNA Lesson Using PTC as an Anchoring Phenomenon
Describes how using anchoring phenomenon can improve lessons on teaching DNA and how the sequence of DNA determines structure and function.
-
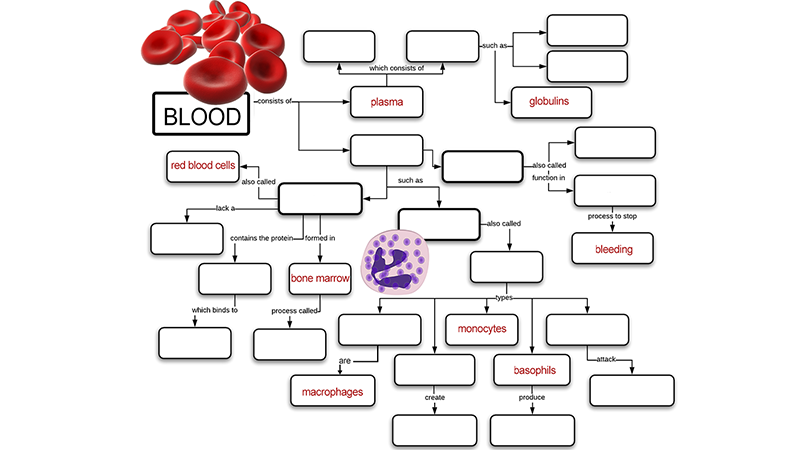
Learn about the Blood Using Graphic Organizers
Students use graphic organizers to learn about the types of blood cells and their functions. Student either complete a concept map or design their own.
-
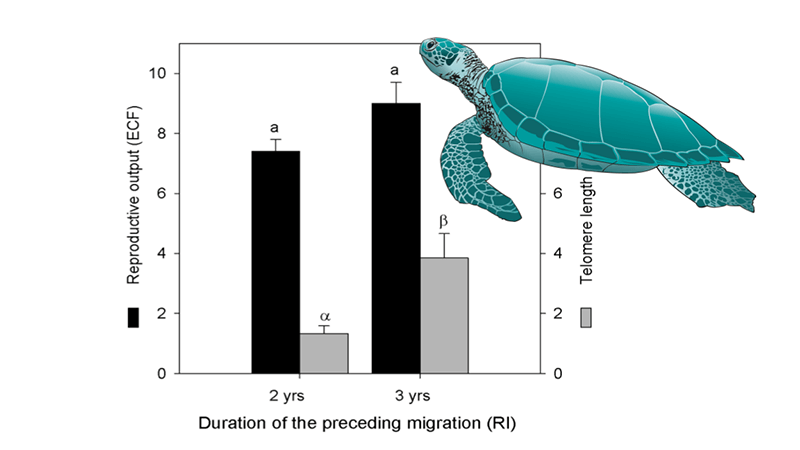
Analyzing a Turtle Graph from Primary Source
Examine data on turtle reproduction and migration. Annotate graphs and develop a claim; use reasoning to support that claim with data.


