Search results for: “biologycorner.com”
-
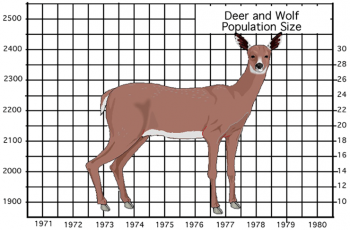
Deer: Predation or Starvation?
This activity asks students to calculate the population change (births – deaths) and then graph the number of deer and the number of wolves.
-
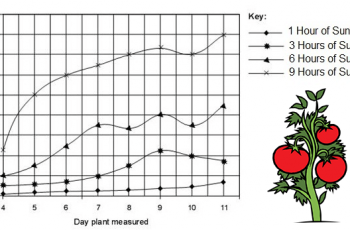
Data Analysis and Interpreting Graphs
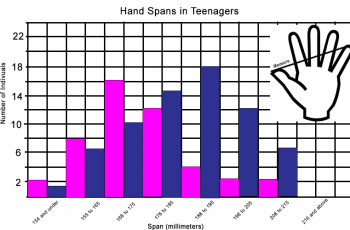
Students practice analyzing pie charts, scatter plots, and bar graphs in the basic worksheet that is designed to pair with lessons on the scientific method. Most beginning biology students (in high school) are fairly adept at interpreting basic information from graphs, though scatter plots are sometimes challenging for them. I usually do this type…
-
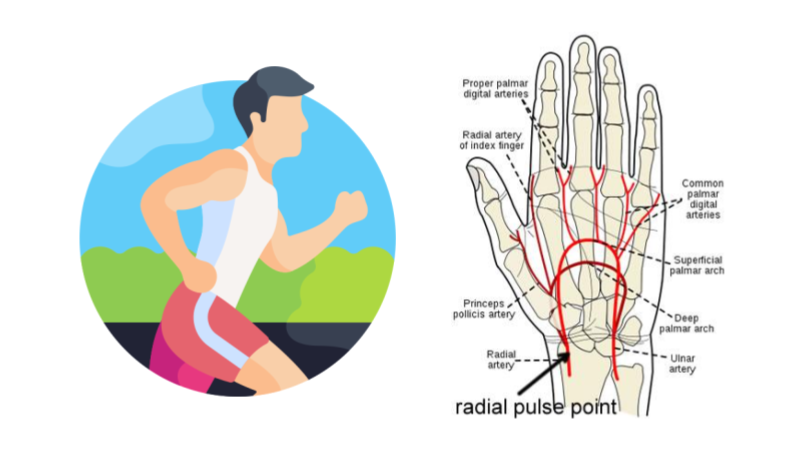
Investigation: How Does Exercise Affect Heart Rate
Design and conduct an experiment to measure the effect of exercise on heart rate. Aligned to NGSS standard on feedback mechanisms.
-

Body Systems Graphic Organizer
Graphic of the body systems where students fill in blanks about structures within the organ system and their functions. This concept map can be used as a review or as a way to organize notes over the body systems.
-
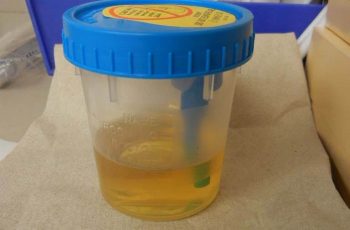
Urine Luck! – A Urinalysis Simulation
Examine urine samples from patients and suggest a diagnosis and treatment plan based on test results. Simulated urine, can be made with basic materials and models basic tests done on real urine.
-
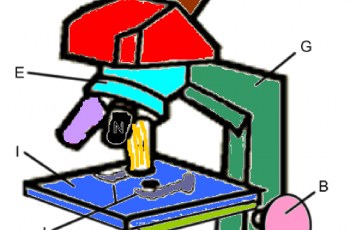
Color the Parts of a Microscope
Students read text that describe the parts and functions of the microscope and ask them to color the parts as they read.
-
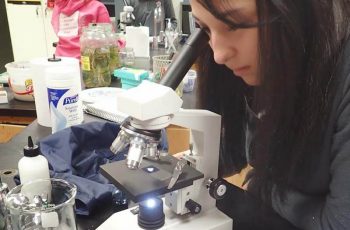
Microscope Labeling
This simple worksheet pairs with a lesson on the light microscope, where beginning biology students learn the parts of the light microscope and the steps needed to focus a slide under high power.
-

Measuring Biodiversity Using Beans
Students analyze a community of beans (pinto, lima, navy) to determine the richness, abundance, and biodiversity index of two communities.
-
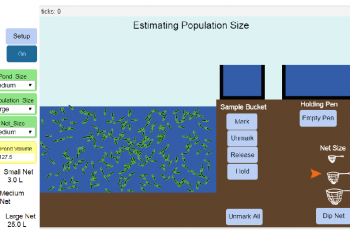
Estimating Population Size: A Netlogo Simulation
Students learn how the “mark and recapture” technique can be used to estimate population sizes by using a netlogo simulation that allows students to alter variables such as population size, and number of individuals marked.
-
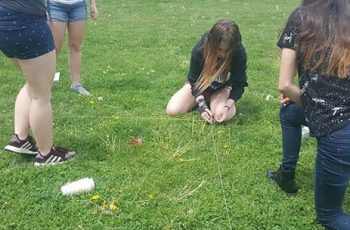
Random Sampling
Students model how field biologists would use a sampling technique to estimate the number of sunflowers in a field. First, they choose 10 plots at random by choosing paper slips, then take the average of those plots. The worksheet walks them through the steps of then using the average and the overall size of the…
-
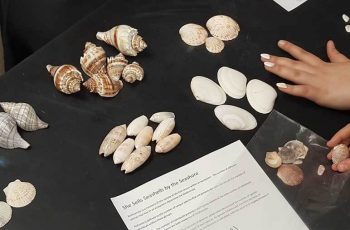
Calculate the Biodiversity Index of a Beach
This activity asks students to sort seashells and calculate the Simpson’s biodiversity index. The calculation is based on the number species in an area, dependent upon richness (number of unique species) and abundance (number of individual species).
-
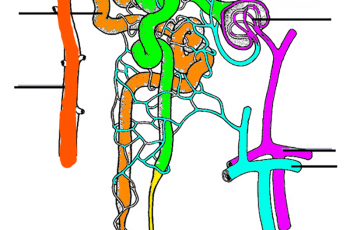
Color and Label the Nephron
Practice labeling the nephron with this reinforcement activity. Students can also color the image to identify the major structures of the nephron: glomerulus, bowman’s capsule, proximal and distal tubules, loop of Henle, collecting duct and capillaries. This was designed to go with a larger unit on how the urinary system and kidneys help the body…


