Search results for: “system”
-
Cell Membrane Captions
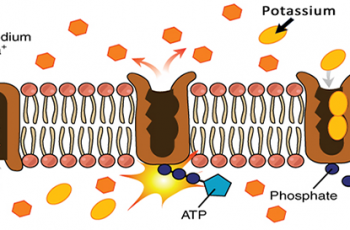
Students examine images of transport across the cell membrane and identify key features such as the phospholipid bilayer, channel proteins, and receptors. Students then provide a title, such as “osmosis” and create a caption that describes the process being shown.
-
Cells Alive Worksheet
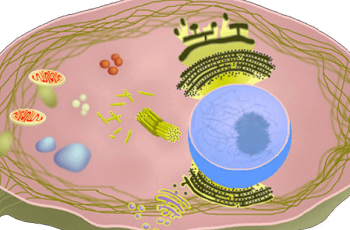
This worksheet follows diagrams and activities at CellsAlive.com which focuses on the size of cells compared to other objects, such as viruses and pollen. Students view interactive plant, animal, and bacteria cells to learn about the different structures associated with each.
-
Investigation: The Effect of Salt on a Potato
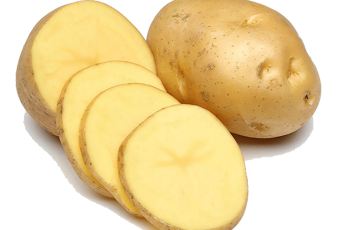
Students observe how the mass of a potato slice changes when soaked overnight in salt water. The activity is intended to be done as part of a lesson on osmosis and hypertonic and hypotonic solutions. Students will need about 15 minutes to set up their cups, weigh their slices and make predictions about what they…
-
Investigation: Exploring Cells
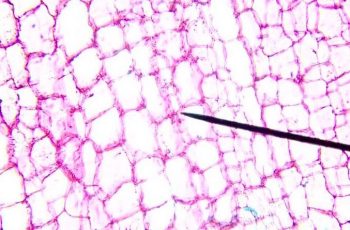
While biologists might find the history of the cell theory fascinating, I notice that many of my students seem to tune-out when you bring up the history of scientific discoveries. In order to save time and improve engagement, I created this lab to include a short history of the cell theory as students explore prepared…
-
Investigation: How Do Enzymes Work?
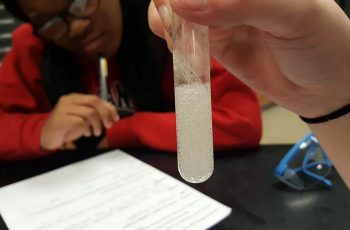
This lab is fairly basic, but when given with guided instruction how enzymes catalyze reactions, students can have a hands-on experience into how proteins are related to function.
-
Investigation: How Can Diffusion Be Observed?
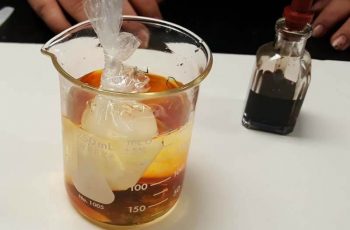
This investigation provides a hands-on way to observe what happens when a chemical moves across a semipermeable membrane. In this case, a cheap plastic bag serves as a model for the cell membrane and shows that iodine will move into the bag and turn the contents purple.
-
Create a Concept Map of Biomolecules
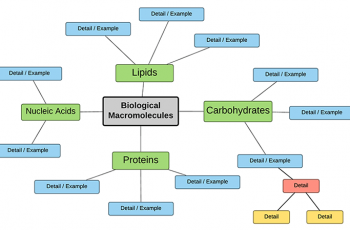
This activity asks students to work in groups to create a concept map (graphic organizer) on the biological macromolecules: carbohydrates, lipids, fats, and nucleic acids. Students are given brief instructions and a sample map to get them started, but they are responsible for determining what details are important in each section.
-
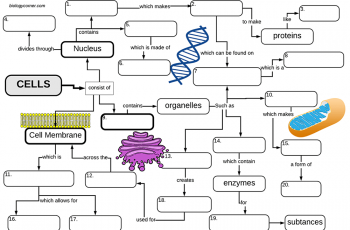
Cell Structures: A Graphic Organizer
This graphic organizer (concept map) organizes the cell structures around three main parts of the eukaryotic cell: the nucleus, cytoplasm, and cell membrane.
-
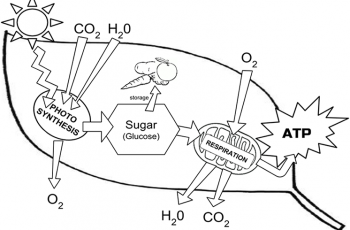
Photosynthesis Coloring
Students read short text passages and then color images to help them relate the textual information with the graphic.
-
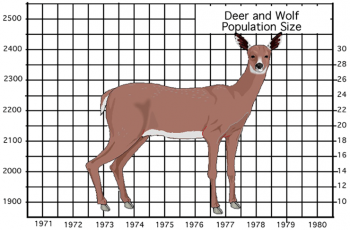
Deer: Predation or Starvation?
This activity asks students to calculate the population change (births – deaths) and then graph the number of deer and the number of wolves.
-
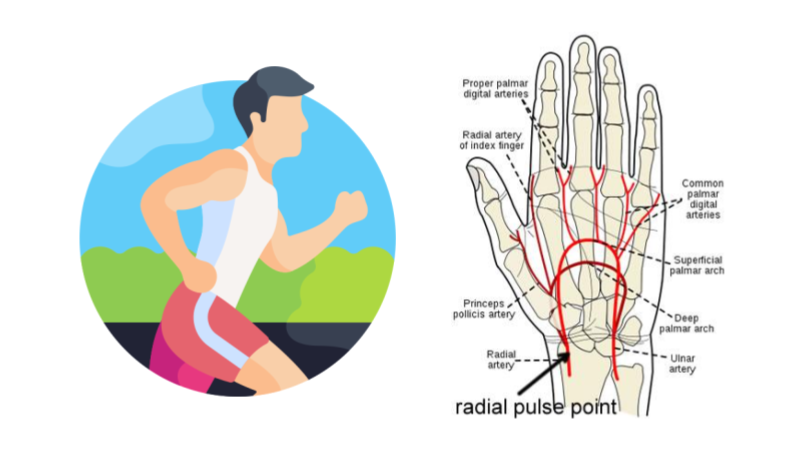
Investigation: How Does Exercise Affect Heart Rate
Design and conduct an experiment to measure the effect of exercise on heart rate. Aligned to NGSS standard on feedback mechanisms.
-

Measuring Biodiversity Using Beans
Students analyze a community of beans (pinto, lima, navy) to determine the richness, abundance, and biodiversity index of two communities.
-
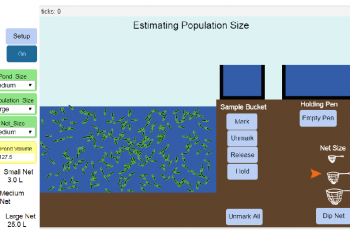
Estimating Population Size: A Netlogo Simulation
Students learn how the “mark and recapture” technique can be used to estimate population sizes by using a netlogo simulation that allows students to alter variables such as population size, and number of individuals marked.
-
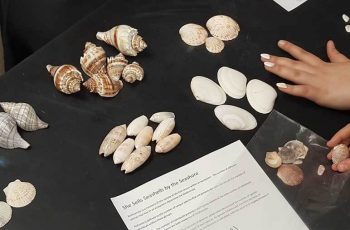
Calculate the Biodiversity Index of a Beach
This activity asks students to sort seashells and calculate the Simpson’s biodiversity index. The calculation is based on the number species in an area, dependent upon richness (number of unique species) and abundance (number of individual species).


