Search results for: “teacher”
-
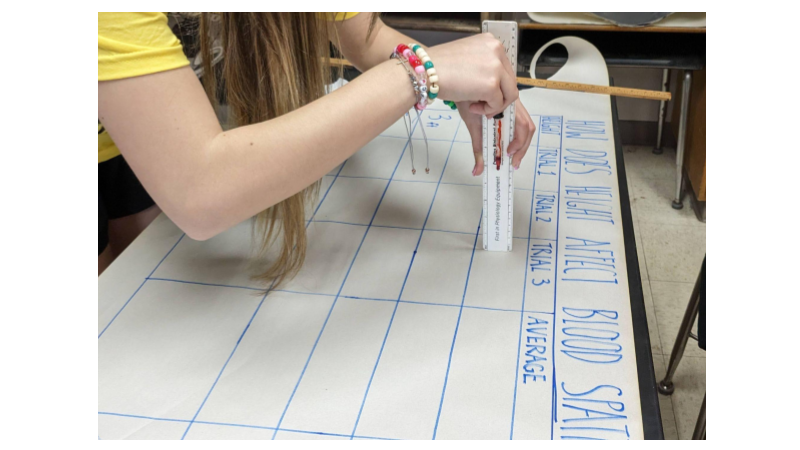
Forensics Lab on Blood Spatter
Explore forensics with this lab on blood stain analysis. Use fake blood to determine how height affects the diameter of the stain
-
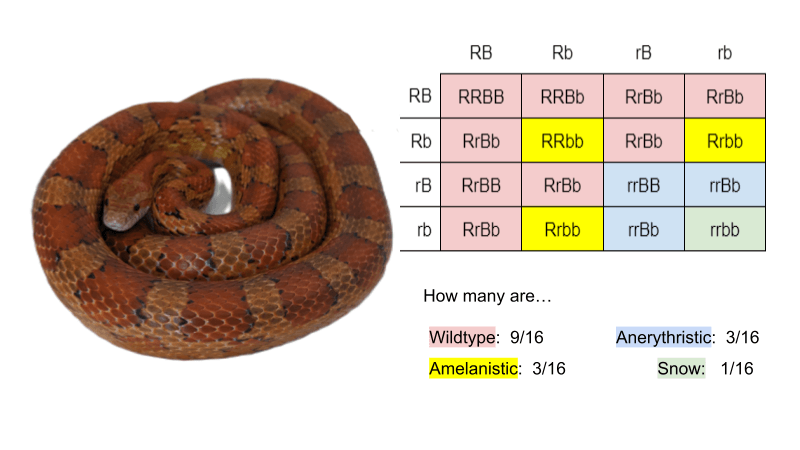
Corn Snake Genetics – Explore the Morphs!
Practice dihybrid crosses with this activity on corn snakes. Corn snakes are red and black, with variations in shade and markings.
-
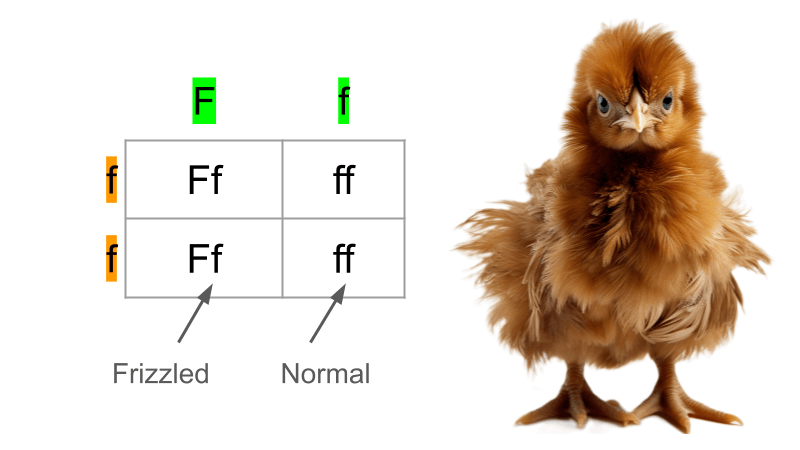
The Genetics of Frizzle Frazzle Chicks
Frizzle feathers in chickens is the result of a dominant allele. Practice crosses between different types of chickens, by completing Punnett squares.
-
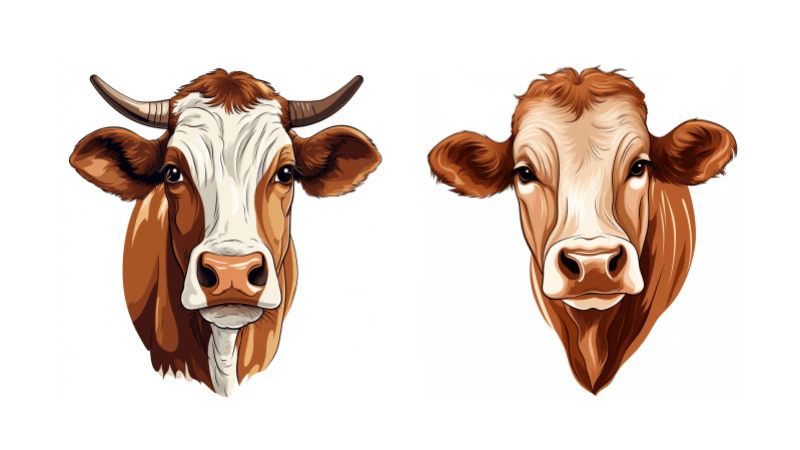
Genetics Practice – Roan Cows with Horns
Practice genetics with cows! Cows can be horned (hh) or hornless. They can also be red, white, or roan colored.
-

Peas, Please! – A Practice Set on Mendelian Genetics
Students practice assigning genotypes (PP, Pp, or pp) to different traits based on whether the trait is dominant or recessive. They set up Punnett squares, and determine the phenotypic ratios of the offspring.
-
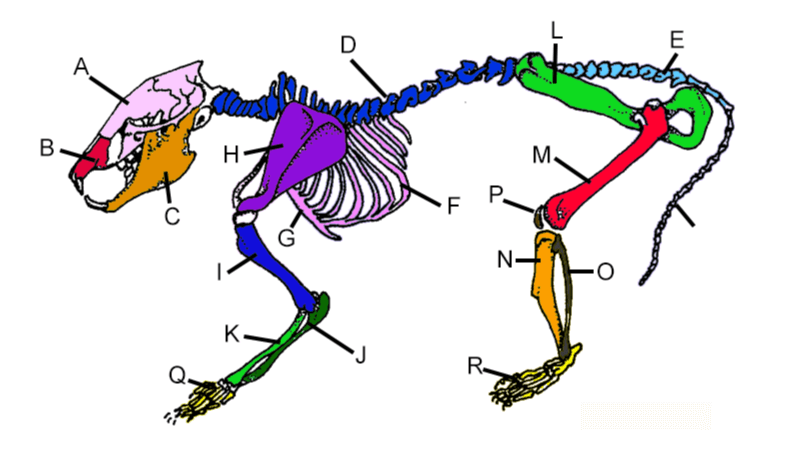
Explore the Skeleton of the Rat with Coloring
Students learn the skeletal system by coloring a diagram of a rat skeleton. Worksheet includes descriptions and locations of each of the bones of the skeleton. The rat skeleton is similar to the human skeleton!
-
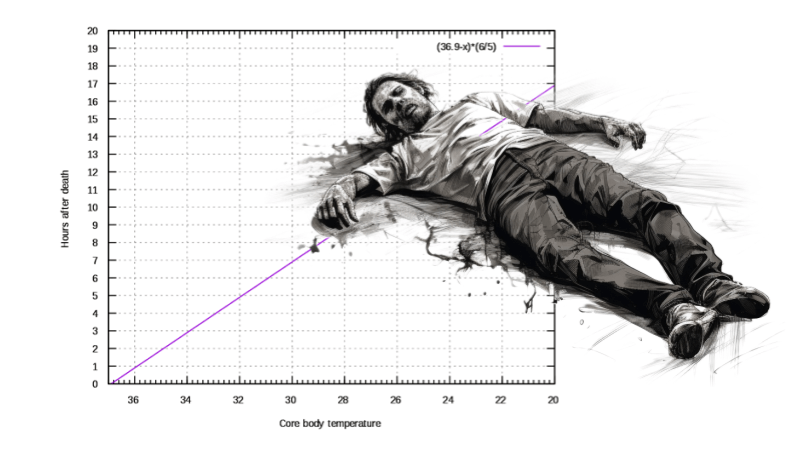
Forensic Activity – Calculating Time of Death
Student activity on forensics where time of death is calculated with an equation or graph.
-
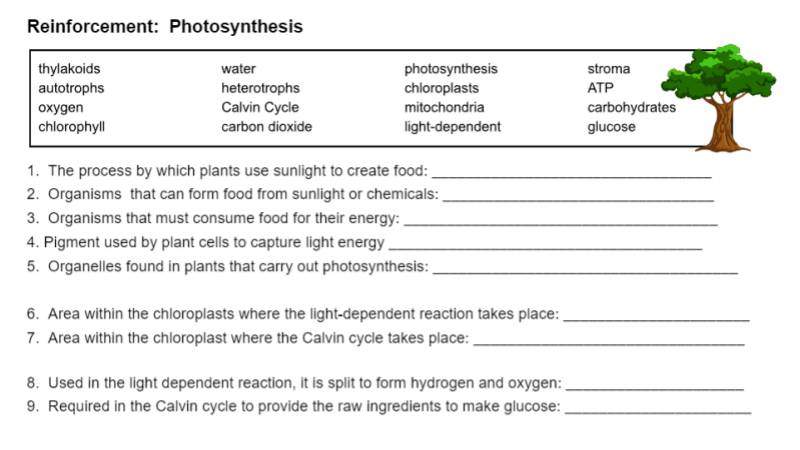
Reinforcement: Photosynthesis
This simple photosynthesis worksheet has a list of vocabulary words that students match to their definitions. Great for review and reinforcement!
-
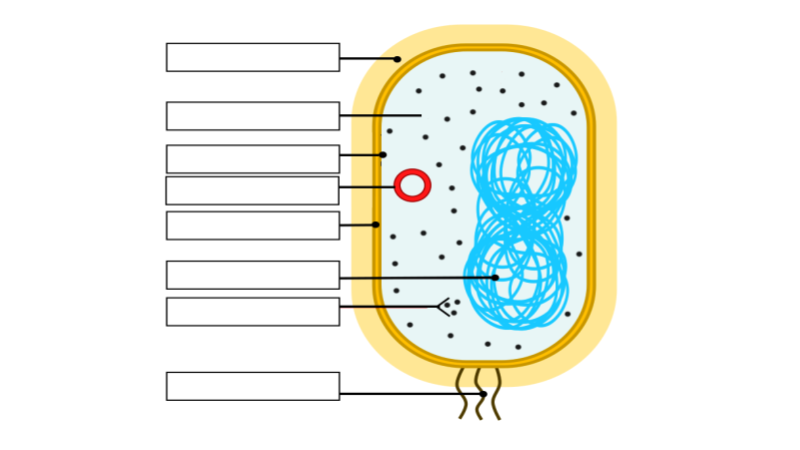
Label a Bacteria Cell
A short activity on bacteria cell form and function. Students label a diagram of a bacteria cell and answer questions.
-
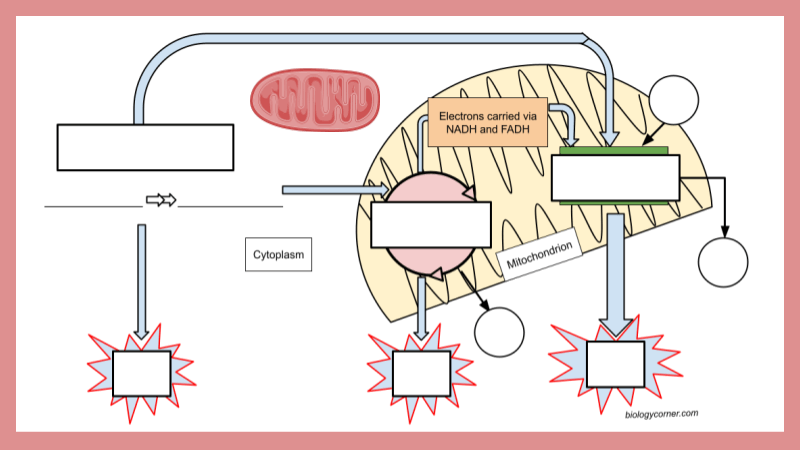
Cellular Respiration Overview
Explore the intricacies of cellular respiration with this engaging worksheet designed for students. Covering glycolysis, the citric acid cycle, and the electron transport chain
-
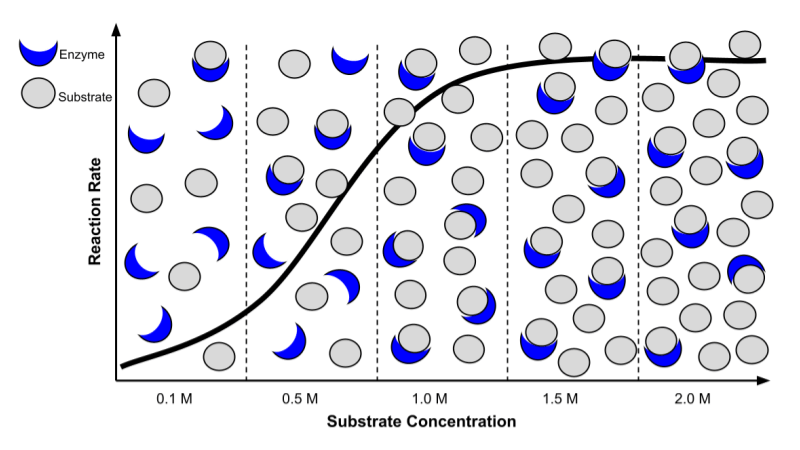
Enzyme and Substrate Concentrations
Students examine graphical models of enzyme and substrate interactions showing how the speed of reactions changes with concentration.
-
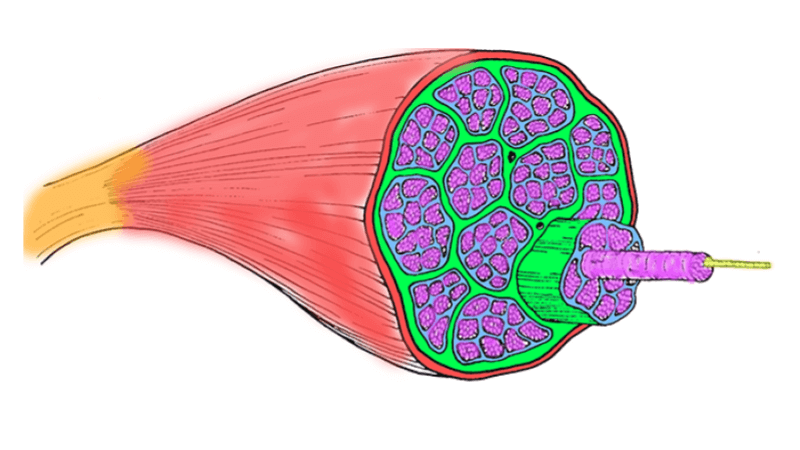
Muscle Anatomy and Coloring
Students practice naming parts of the muscle by matching terms to definitions and coloring a muscle.
-

Interpreting a Food Web and Trophic Levels
Students analyze a food web and determine the types of consumers, herbivores, carnivores, and omnivores. Then they construct a pyramid of numbers.
-
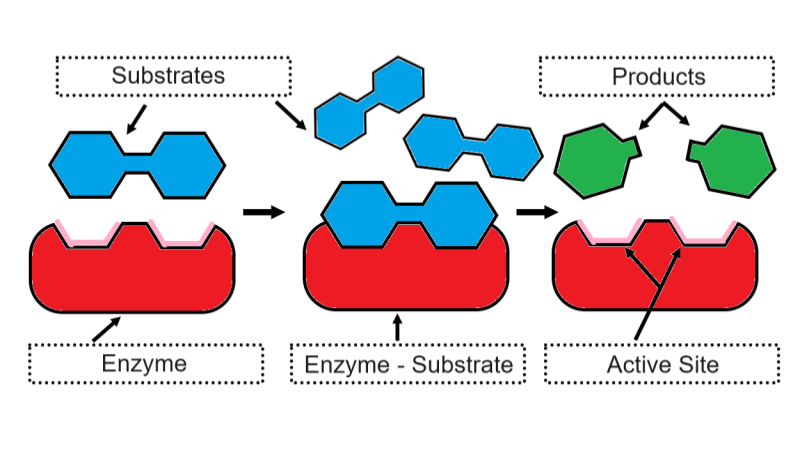
Enzymes and Substrates – Coloring
A simple worksheet showing how enzymes bind to substrates to create products. Students color a graphic and answer questions.
-
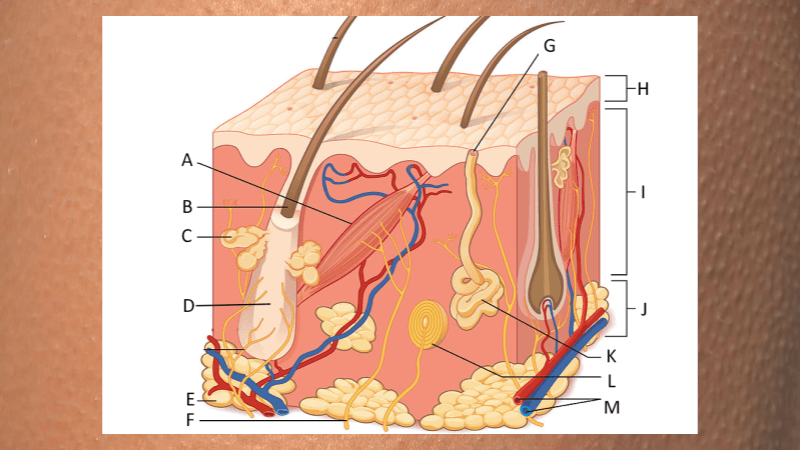
What Causes Goosebumps? – Anatomy of Skin
Students label an image showing the cross section of skin. Text explains what each structure does and focuses on the phenomenon of goosebumps.

