Tag: temperature
-
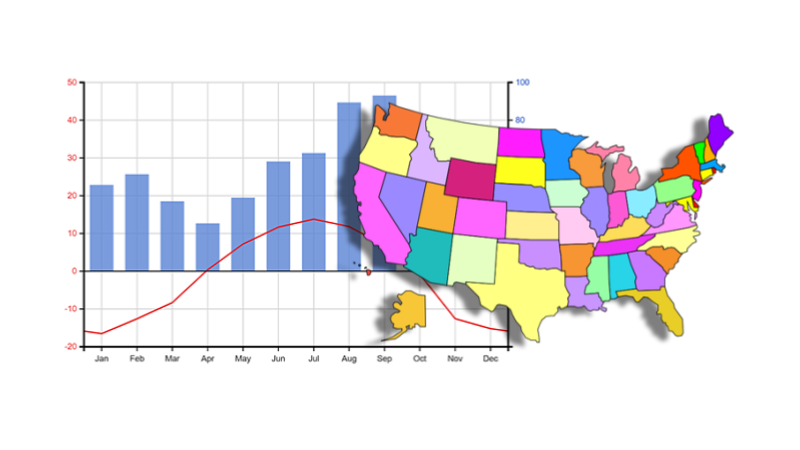
Analyze Data and Create a Climate Graph
Students practice analyzing climate graphs of four regions in the United States. Answer simple questions and create a graph from data collected in Germany.
-

Investigating Sea Turtles and Sex Determination
Create a model of a turtle nest to record temperatures at different depths. The temperature of the nest will determine whether turtles are male or female.
-
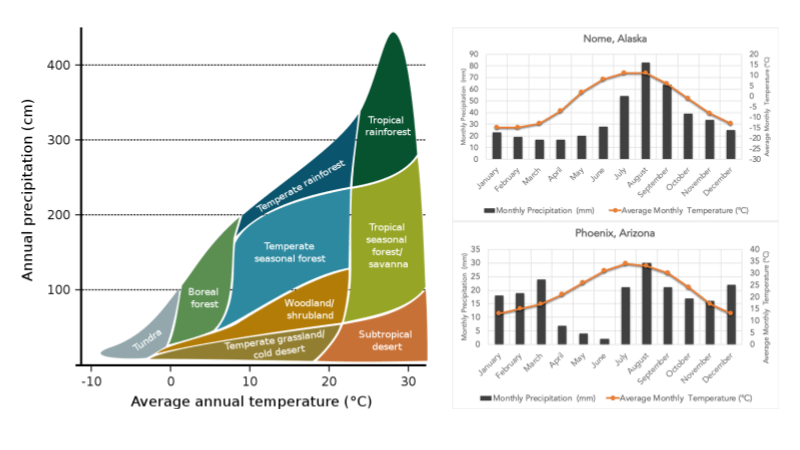
Analyzing Data – Explore Features of Biomes
Practice analyzing data from graphs in this exercise. There are several graphs that show precipitation and temperature of nine major biomes of the world.
-
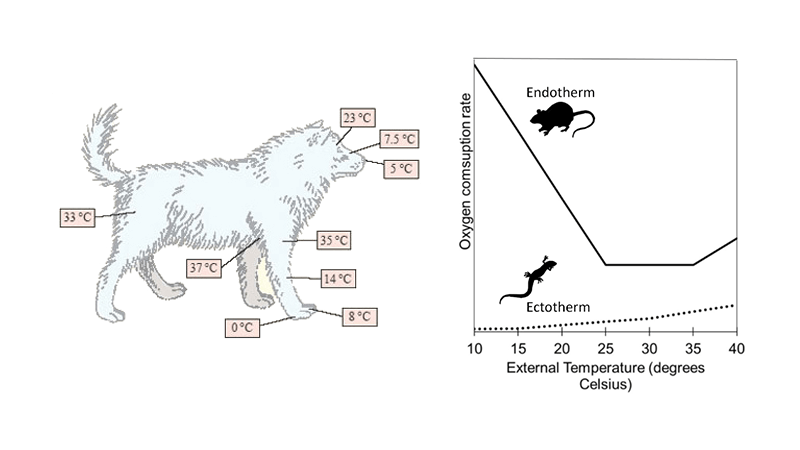
How do Mammals Maintain Their Temperature (CER)
Students examine graphs and images to develop an understanding of how mammals maintain their body temperatures compared to ectothermic animals.
-
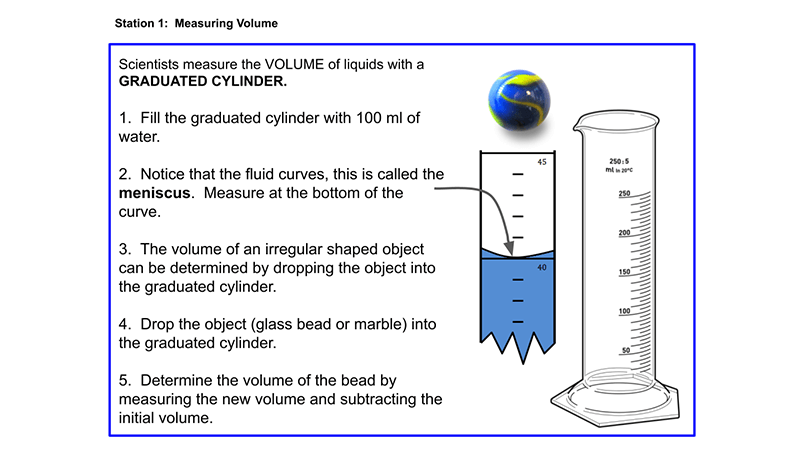
Introductory Activity on Using Science Equipment
Learn to use scientific tools in this station activity. Determine volume, length, temperature, and mass by visiting stations in the lab and performing tasks.
-
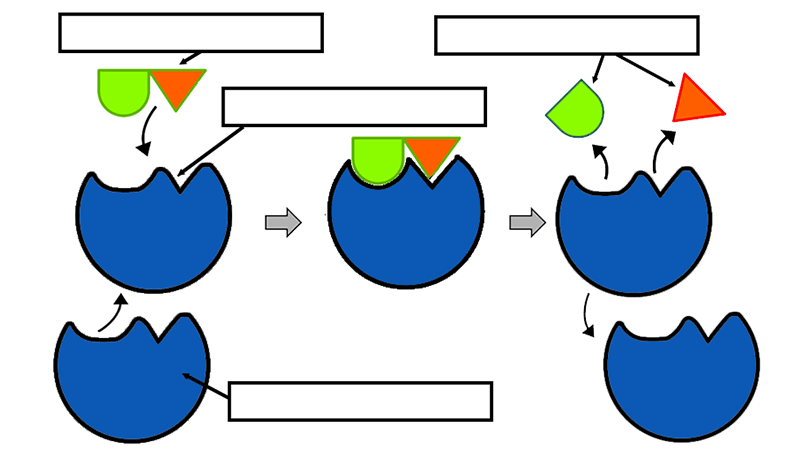
Exploring Enzymes by Analyzing Graphics
Students examine several images related to enzymes and answer questions. Worksheet covers how enzymes act on substrates, how they lower the activation energy of a reaction, how they have optimal temperature and pH, and how they can be inhibited.
-
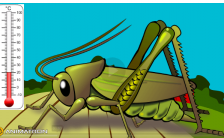
Investigation: What Factors Affect Cricket Chirps?
One of my favorite scientific method activities was a project that used a flash simulation to investigate cricket chirps and how the frequency is affected by temperature, humidity and wind speed. Unfortunately, flash is no longer supported by modern browsers. This alternative assignment asks students to listen (and count) cricket chirps, create a data…
-

Investigation: Temperature and Fish Respiration Rate
Students investigate what happens to the respiration rate of a fish as the temperature is decreased. Analyze data and create a graph.


