Measuring the Differences in Carbon Dioxide Production
In this investigation, you will understand how carbon dioxide alters the color of bromthymol blue and use a titration technique to measure the amount of carbon dioxide added to bromthymol blue. Using this technique you will also be able to compare the amount of carbon dioxide produced by a person at different levels of physical activity.
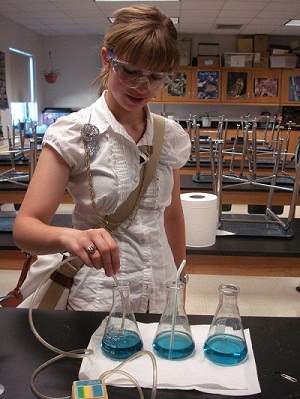
The Titration Technique:
Procedure: Use a straw to exhale air into a flask containing a solution of bromthymol blue. When the solution changes colors, practice changing it back again by adding drops of sodium hydroxide. The more drops of sodium hydroxide needed, the greater the amount of carbon dioxide in the flask. Practice this procedure until you are comfortable with adding the sodium hydroxide. (Important, you need to swirl the flask after adding the drops to see if the color changes, sometimes the change is delayed)
The Experiment: Choose one of the following questions related to carbon dioxide and the nature of the indicator - bromthymol blue.
How does a the amount of carbon dioxide a person exhales change as a result of physical activity?
Are there any other factors that might affect the amount of carbon dioxide in exhalation?
- hyperventilating into a paper bag
- chewing gum or mints
- holding your breath
As a group develop a hypothesis and design an experiment to test your hypothesis. You may use one or all of your group members as guinnea pigs. Very little information is included here as far as how you should conduct your experiment. You are expected to design your own experiment, taking into account controls and variables. Enough data should be taken to form conclusions.
Extension Experiment
Will the color change if an aquatic plant is placed in a diluted solution of bromthyol blue? In other words, do plants also release carbon dioxide? (Requires aquarium plant, anacharis or similar).
Submission Options (check with your instructor for details)
Option 1: InfoGraphics
Inforgraphics can be made with popplet or http://visual.ly/ or gliffy or piktochart
Include the following information:
1) What was your question or central test?
2) How did you test this? What were challenges you had to overcome in this experiment?
3) What data was gathered and how did this compare to the data of other groups?
4) Answer the experimental question(s), it is okay to say that some things remain unknown
5) Discuss questions you still have and any further tests that might solve the problem?
6) Identify sources of errors in the experiment, problems with data collection or problems with the test
7) Include any images that relate to your experiment, this is an important part of any infographic
Option 2: Traditional Lab Report
You will each turn in a lab report that should follow the lab report template, also answering the basic questions above. This report should be typed.
Option 3: Video Presentation
Use prezi or google slides to create a presentation showing your experiment and results. See questions in option 1 for guidelines on information to use in the presentation.
 This work is licensed under a Creative Commons Attribution-NonCommercial-ShareAlike 4.0 International License.