Peppered Moth Simulation (Kit)
Objectives:
Describe the importance of coloration in avoiding predation
Relate environmental change to changes in organisms
Explain how natural selection causes populations to change
Materials
Light Bark Paper, Dark Bark Paper, 10 Light Moths, 10 Dark Moths
(From Kit) , Colored Pencils , Forceps, Clock with Second Hand,
Purpose
In this lab, you will simulate how predators locate prey in different environments. You will analyze how color affects and organism's ability to survive in certain environments.
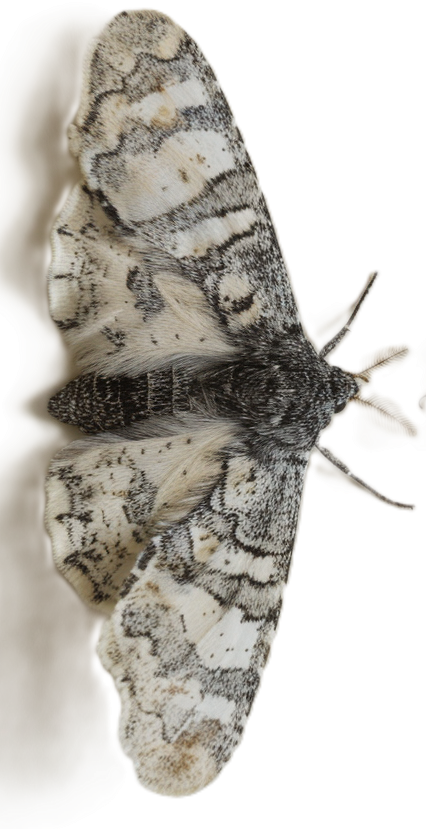
Industrial Melanism is a term used to describe the adaptation of a population in response to pollution. One example of rapid industrial melanism occurred in populations of peppered moths in the area of Manchester, England from 1845 to 1890.
Before the industrial revolution, the trunks of the trees in the forest around Manchester were light grayish-green due to the presence of lichens. Most of the peppered moths in the area were light colored with dark spots. As the industrial revolution progressed, the treee trunks became covered with soot and turned dark. Over a period of 45 years, the dark variety of the peppered moth became more common.
Procedure.
1. Decide who will be the "predator"
and who will be the timekeeper.
2. Place the light bark paper on the lab table. If you are the timekeeper,
scatter 10 light moths and 10 dark moths on the paper while your
partner looks away.
3. The "predator" will then look back and try to pick up as
many of the moths as they can in 5 seconds using the forceps. Record the
numbers on the chart.
4. Count the number of remaining moths and record as your final population.
5. Double the number of remaining moths and record as your starting population for the next generation. (For example, if you had 7 dark moths remaining as your final population, you will have 14 as your starting population for the
next generation.) Repeat this process to create a third generation.
6.
Switch roles (predator and timekeeper) and repeat the steps, this time placing your moth populations on the dark bark paper. Record the data for three generations
| Populations Start on Light Bark Background | ||||||
| Starting Population | Final Populations (how many of the original were left ) | |||||
| Generation | Dark | Light | Dark | Light | Double these final numbers to get your starting population for the next generation | |
| 1 | 10 | 10 | ||||
| 2 | ||||||
| 3 | ||||||
| Populations Start on Dark Bark Background | ||||||
| Starting Population | Final Populations (how many of the original were left ) | |||||
| Generation | Dark | Light | Dark | Light | Double these final numbers to get your starting population for the next generation | |
| 1 | 10 | 10 | ||||
| 2 | ||||||
| 3 | ||||||
Analysis
1. Describe how the population of moths changed in each generation for both the dark and light moths.
2. What moth coloration is the best adaptation for a dark background? How do you know?
3. How does the simulation model natural selection?
4. Examine the table and construct a graph. Plot the years of the study on the X-axis, and the number of moths captured on the Y axis. You should have 2 lines on your graph - one for light moths, and one for dark moths.
Year |
#
of Light Moths Captured |
#
of Dark Moths Captured |
2 |
537 |
112 |
3 |
484 |
198 |
4 |
392 |
210 |
5 |
246 |
281 |
6 |
225 |
337 |
7 |
193 |
412 |
8 |
147 |
503 |
9 |
84 |
550 |
10 |
56 |
599 |

5. Explain in your own words what the graph shows. What type of environment do you think these moths live in?
Other Resources on Evolution
Peppered Moth Simulation - updated simulation on the peppered moth
Modeling Natural Selection - use tools such as spoons to "capture" beans and determine the best adaptations
How Did the Guppy Get His Color - guided case study exploring pools in Trinidad and guppy coloration; includes data analysis comparing pools with predators to those without
Natural Selection with Bunnies and Wolves - interactive simulation at phet.colorado.edu where students manipulate variables such as climate, fur color, presence of predator, or food limitations.